Tutorial
● AnalysisWe provide tools to calculate GSGPs using Variant Calling Format (VCF) file, which is one of the most commonly used formats for recording mutations. To start an analysis, please click Analysis button in the top menu.
I. Please Choose a VCF file in your disk (1 in Figure 1). VCF or gzip-compressed VCF with GT (genotype), AD (allelic depths), and DP (read depth) fields is needed. Multi-sample VCF is also supported. File size should be smaller than 10Mb.
II. Please Select the reference genome used by your VCF file (2 in Figure 1). Human genome hg19 (GRCh37) and hg38 (GRCh38) are currently supported.
III. It is sufficient to start the Analysis (3 in Figure 1) without adjusting other parameters. The meanings of the advanced parameters are shown below. If you have other needs (e.g. larger VCF file, other species, larger upstream/downstream distance, more threads, more iterations of decomposition, etc.), please use the Python scripts in the Download page.
- Min read depth: The minimum value of read depth (DP field in VCF). (limit: ≥0)
- Min/Max VAF: The minimum/maximum value of variant allele frequency (VAF). (Min VAF limit: 0-1, Max VAF limit: 0-1 and ≥Min VAF)
- Max upstream/downstream distance: The maximum base pairs that allows the variant to be located upstream/downstream of the gene. (limit: 0-300kb)
- Exon/Intron/Upstream/Downstream variant weight: The weight of exon/intron/upstream/downstream variants when a variant can be annotated to multi-genes. (limit: ≥0)
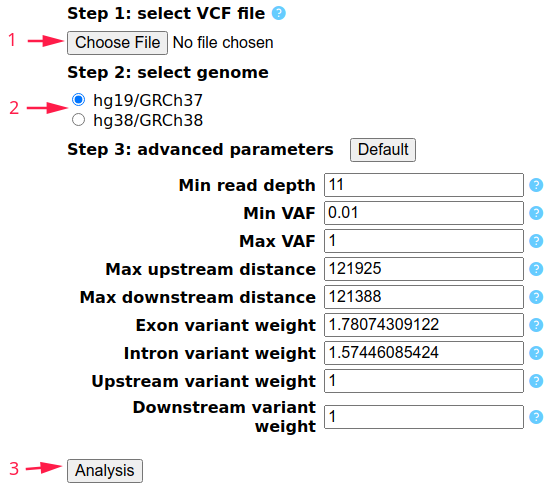
Figure 1: Analysis Page
● ResultA 6-character-length Task ID (red box in Figure 2) will be given after submitting an analysis. Input the Task ID in the Result page and Search for the results. You can also input an example Task ID '000000', which is a dataset of GSGPs generated from 100 randomly selected samples of The Cancer Genome Atlas (TCGA) Skin Cutaneous Melanoma (SKCM) project using the default advanced parameters. If the calculation task is not completed, a log file showing the current progress will be displayed (Figure 2). Or you will get the GSGPs shown by a heatmap (Figure 3).
By default, for each SBS signature and for each gene, we count the number of samples with the GSGP values > 0 respectively. And the heatmap shows the genes with maximum count in each signature.
Additionally, we offer personalized adjustments to the content displayed in the heatmap. You can Filter the sample(s) / gene(s) / signature(s) of interest (1 in Figure 3) and aggregate this 3-dimensional data into 2 dimensions along an Axis (sample / gene / signature) using a Method (mean / median / count) (2 in Figure 3). For example, using Axis 'Gene' and Method 'Median', you will get the median values of GSGPs of all the genes of interest, for each sample and each signature of interest.
For another example, we will show how to get the results of a particular sample. In the result heatmap page, you can choose only one sample of interest in Filter-Sample, and set the Aggregation-Axis as 'Sample' and Aggregation-Method as 'Mean', and click 'Refresh'. Calculating the mean values for one sample is equivalent to the exact values of this sample.
Click 'Download Current Page' (3 in Figure 3) to download the data shown by the current heatmap in CSV format. Click 'Download Whole Results' (4 in Figure 3) to download all the GSGPs of all the samples & genes & signatures in gzip-compressed CSV file.
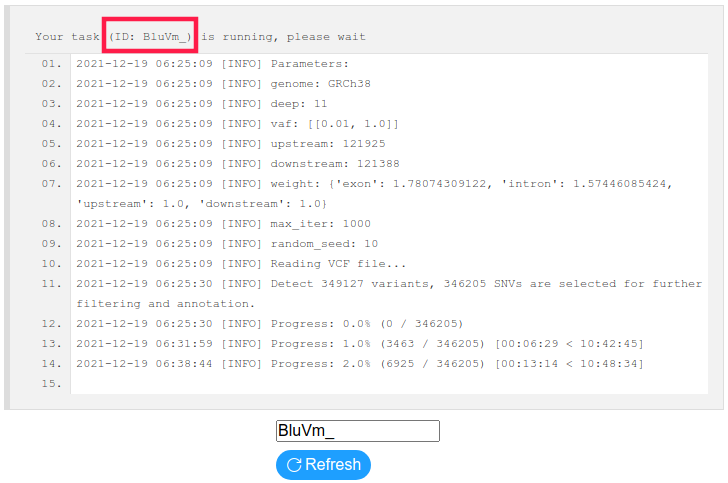
Figure 2: Result Page (log)
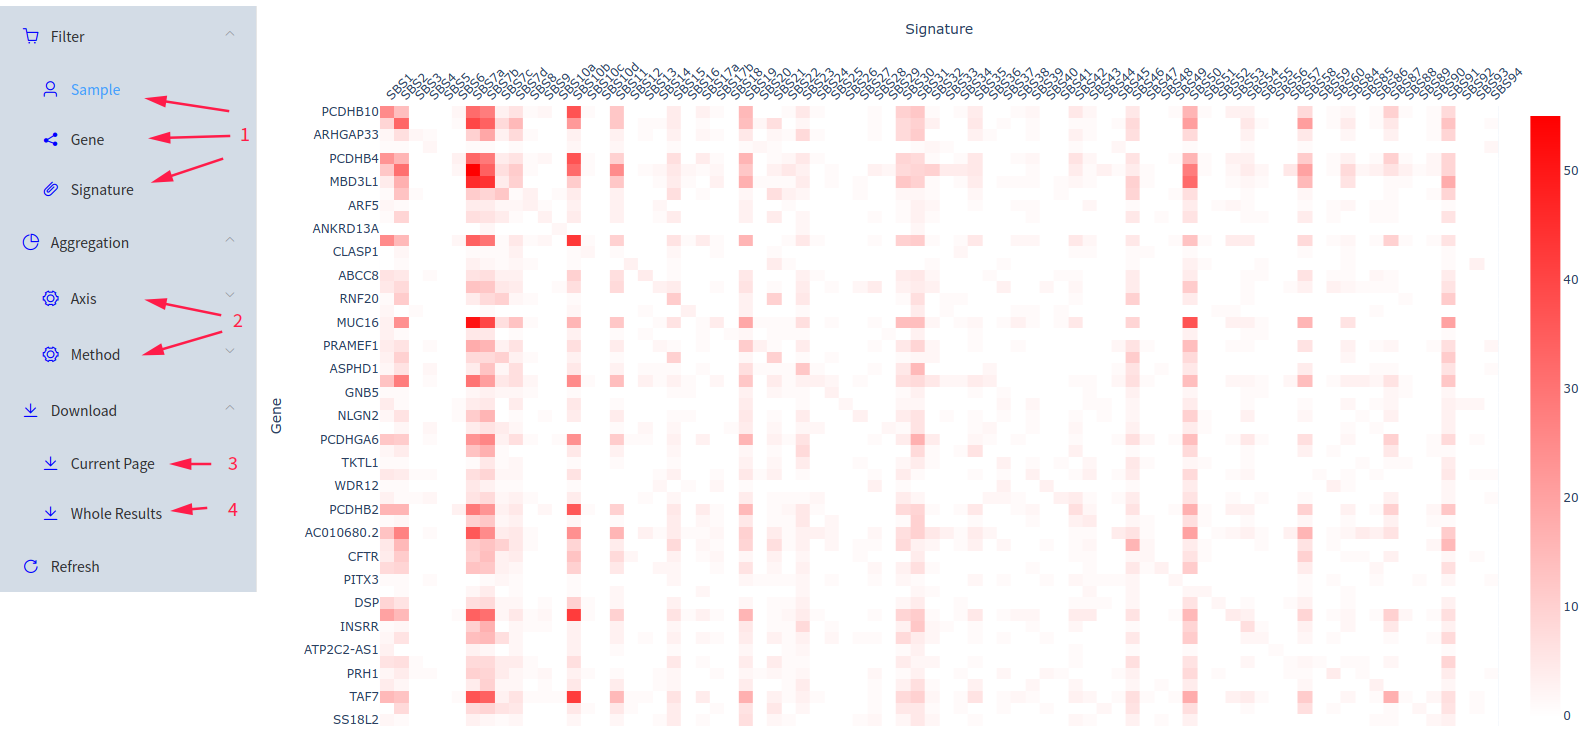
Figure 3: Result Page (heatmap)
● DownloadIf you have other needs (e.g. larger VCF file, other species, larger upstream/downstream distance, more threads, more iterations of decomposition, etc.), please use the Python scripts provided in the Download page. The SBS signatures, gene annotations, and reference genomes we used can also be found in this page.
● CitationPlease cite: Ji X, Wang E, Cui Q. Deciphering gene contributions and etiologies of somatic mutational signatures of cancer. Brief Bioinform. 2023;bbad017. PMID: 36682004