Tutorial
● SearchTo search smORF/microprotein, please click Search button in top menu. Users can seach a smORF/microprotein by sequence or by coordinate.
For searching by sequence, exact match or BLAST (blastn, blastp, blastx, tblastn, tblastx) can be used (Step 1 in Figure 1). Then input a nucleotide or protein sequence below (FASTA format or just a sequence) (Step 2) and click 'search' button (Step 3).
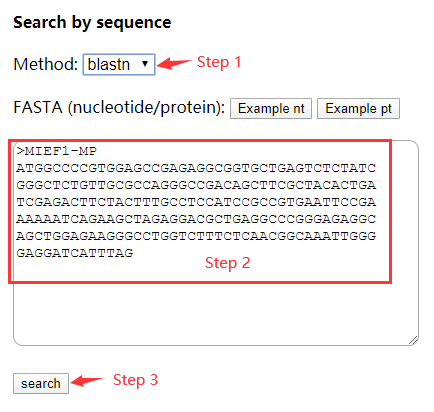
Figure 1 Search by sequence
For searching by coordinate, select the reference genome (GRCh37/hg19 or GRCh38/hg38), chromosome, and strand (both/+/-). Then input a start and end position of the selected genome. Click 'search'. (Figure 2)
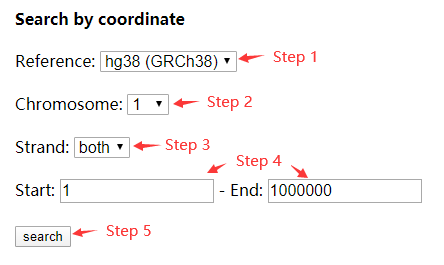
Figure 2 Search by coordinate
The search results table contains the following columns:
- Internal ID: Internal ID of every unique smORF we collected, which will be used in function prediction (1 in Figure 3). Click the internal ID to show more details (2 in Figure 3), including coordinates (hg19 and hg38), sequences (nucleotide and protein), the source database(s) where we collected this smORF. For the smORFs searched by BLAST, the alignment information is also given (Figure 4).
- Chr (hg19): The chromosome(s) of hg19 (GRCh37) where the smORF located.
- Strand: The strand where the smORF located.
- Start: The start position(s) (1-based) of the exon(s) of smORF.
- End: The end position(s) (1-based) of the exon(s) of smORF.
- Predict: Click to jump to the function prediction page of smORF (3 in Figure 3).
For the smORFs searched by BLAST, two additional columns were given, which are Bit Scores and Expectations given by BLAST algorithm (4 in Figure 3).
Click 'New Search' to start a new search (5 in Figure 3). Click 'Download TSV' to download the search results in tab-separated files (6 in Figure 3).

Figure 3 Search results

Figure 4 Detail information of a smORF
● PredictStep 1: Input an internal ID of smORF and click 'confirm' (Figure 5). Internal ID can be acquired by Search. Or just click 'predict' on the right of search results table.
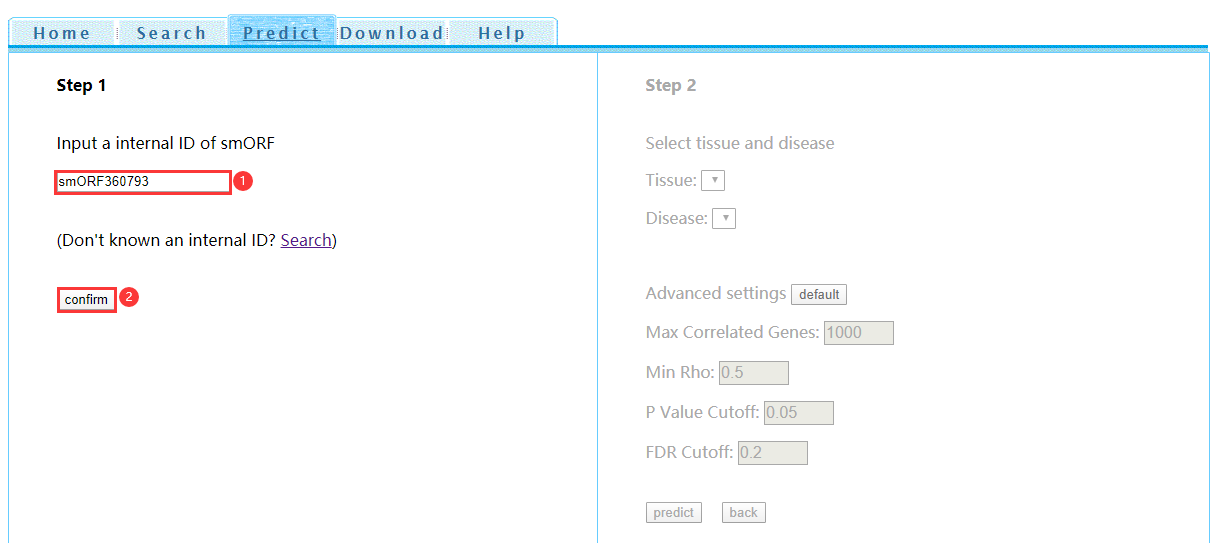
Figure 5 Function prediction step 1
Step 2: After confirming the internal ID, the information of such smORF will be shown on the left. Choose the tissue and disease (or normal) of interest and then click 'predict' for function prediction (Figure 6).
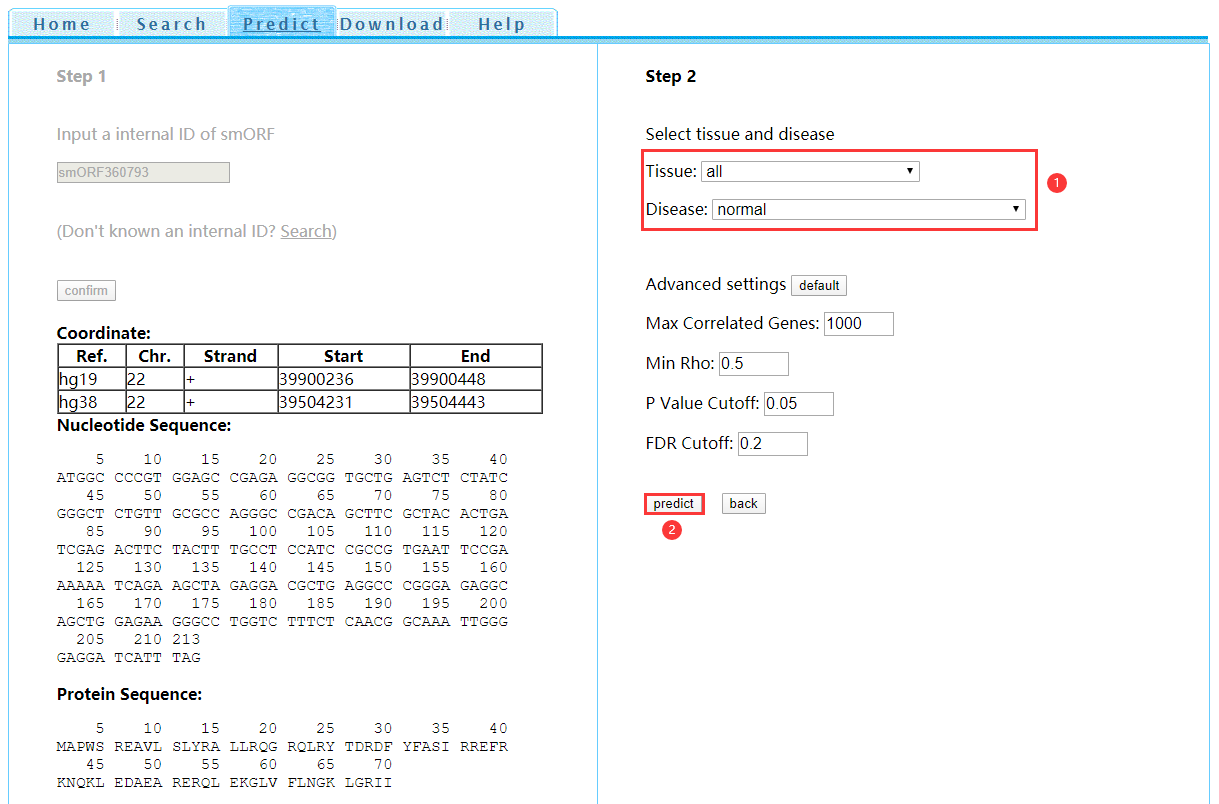
Figure 6 Function prediction step 2
If the prediction used more than one dataset, summary results would be shown. The result of each dataset can be entered from the navigation bar (1 in Figure 7).
Functional terms include three databases: Gene Ontology (GO, further separated into biological process, cellular component, and molecular function), Kyoto Encyclopedia of Genes and Genomes (KEGG) and REACTOM (2 in Figure 7).
The prediction results table contains the following columns:
- Term: The functional terms defined by each database.
- Count: The number of smORF correlated genes contains in such term.
- Ratio: The ratio of smORF correlated genes to all genes in such term.
- Fold: The fold change of Fisher's exact test (ad/bc).
- P-value: The p value of Fisher's exact test.
- FDR: False discovery rate calculated using Benjamini-Hochberg method.
- Bonferroni: False discovery rate calculated using Bonferroni method.
Click 'Download TSV' to download the prediction results in tab-separated files (3 in Figure 7).

Figure 7 Prediction results
● DownloadThe nucleotide and protein sequence (in FASTA), coordinate information (in GTF and BED) and the data source of smORFs we collected can be downloaded from this page.
● Q/A1. Why 'smORFXXX does not have a prediction model'?
We estimate the expression of smORFs by probe re-annotation. If the coordinate of smORF does not overlap with any microarray probes, the expression of this smORF cannot be estimated, neither do function prediction.
2. What do the advanced parameters in Predict page mean?Max Correlated Genes is the maximum number of correlated genes used for function enrichment. Min Rho is the minimum correlation coefficient cutoff for selecting smORF correlated genes. P Value Cutoff and FDR Cutoff are the maximum p value and FDR for filtering prediction results.
3. How to cite this tool?Please cite: Ji X, Cui C, Cui Q. smORFunction: a tool for predicting functions of small open reading frames and microproteins. BMC Bioinformatics. 2020 Oct 14;21(1):455. PMID: 33054771