WEAT
Weighted Enrichment Analysis Tools
Welcome to WEAT
Weighted Enrichment Analysis Tool (WEAT) is a tool for weighted gene function and pathway analysis.
Overview
Gene function and pathway enrichment analysis is one of most popular class of bioinformatic tools. Currently, the available tools take each gene in one gene set as equal weight, however, actually the essentiality or importance of the genes in one gene set should be different. This point could affect the analysis result greatly and thus should be considered. Given the above observation, here we developed, WEAT v1.0, for weighted gene function and pathway analysis. For any given gene list, WEAT tool is able to:
- Identify enriched biological/medical terms
- Highlight biological/medical terms enriched in only weighted condition
- Visualize genes on KEGG pathway maps
- Show other term-genes not in the input gene list
- Redirect to related resources
- Give downloadable results
Click Help to know more.
Statistics
- 17 species
- 334 gene functional categories including 144 for Homo Sapiens
- 557917 gene sets including 320081 for Homo Sapiens
- 793 metrics to evaluating the essentiality / importance of genes including 566 for Homo Sapiens
History
- Feb 27, 2023: Supporting ID Converter; Bugs fixed.
- May 30, 2021: Supporting multiple scores selection; Supporting pie plot visualization; Bugs fixed.
- January 29, 2021: WEAT v1.0 was released.
Contact
Qinghua Cui, PhD
cuiqinghua@hsc.pku.edu.cn
Department of Biomedical Informatics,
School of Basic Medical Sciences,
Peking University, Beijing, China
WEAT User Manual
Contact Us
Please read the Analysis Wizard first. If you still got problems, please contact: r.fan#bjmu.edu.cn (replace # to @)
Analysis Wizard
- Click "Analysis" on the top of the web page to start an analysis.
-
Follow the steps shown in this tab:
Note that there will be an example data as default value in each field. You can replace them with your own data.- Step 1: Select Species. Choose the species you are interested in.
- Step 2: Select Input Type. We are here providing 2 input types: Single Gene List for Differentially expressed gene analysis; Two Gene Lists for the analysis of up- and down-reuglated gene lists. Note that Two Gene Lists analysis can only analyze the category with both up- and down-regulated gene sets in the knowledge base.
- Step 3: Enter Gene List(s) (Gene Symbols‚ Ensembl ID or ENTREZ ID).
- Step 4: Select Gene Essentiality Score and corresponding Scaling Factor (Q). After selecting Gene Essentiality Score and corresponding Q, please click the `Add` button to add this score pair to the list in Step 4.3. There can be multiple scores and Q pairs for one analysis and all the selected pairs are merged to one final score and do the weighted enrichment analysis.
- Step 5: Submit Calculation.
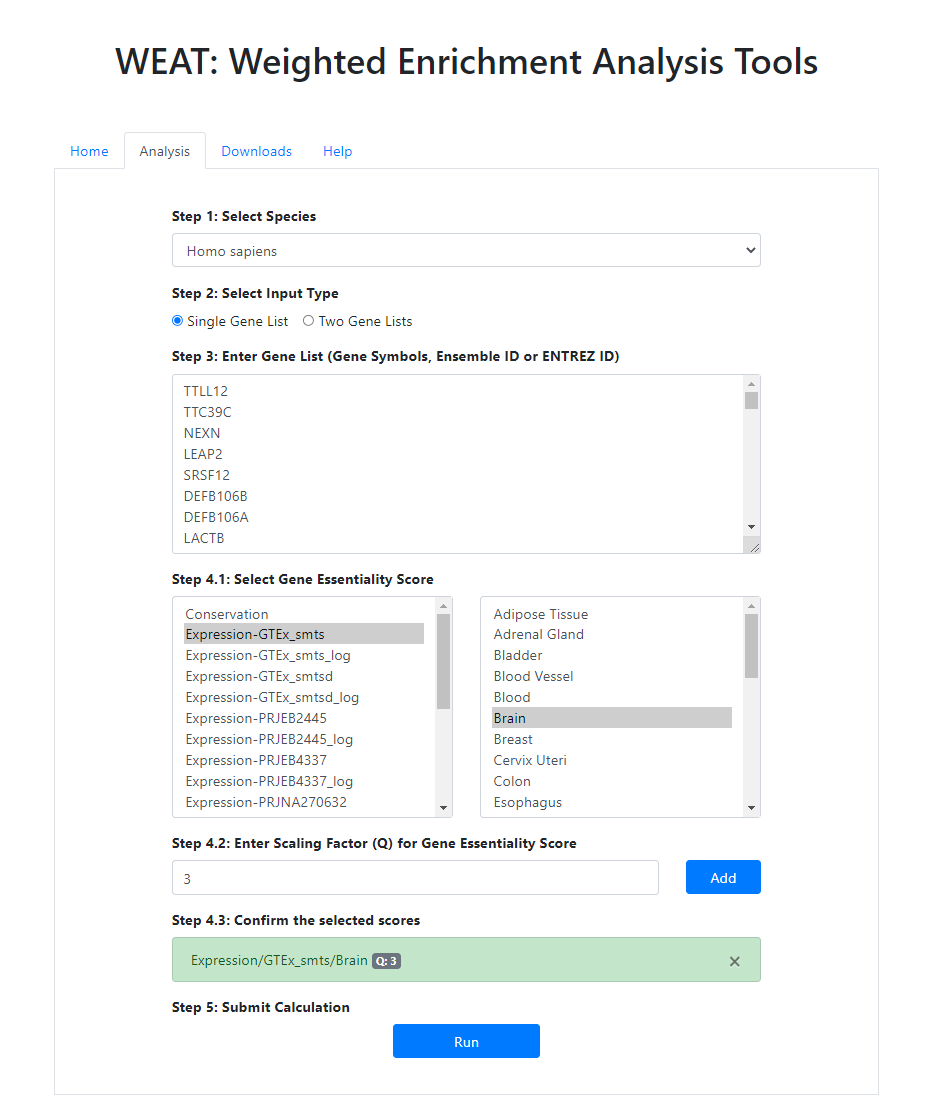
Figure 1. Analysis page.
-
You will get a result page including brief information of your submission on the top and a statistical table listed as follows. The statistical table including information and operation of gene sets databases where you can have (weighted) enrichment analysis.
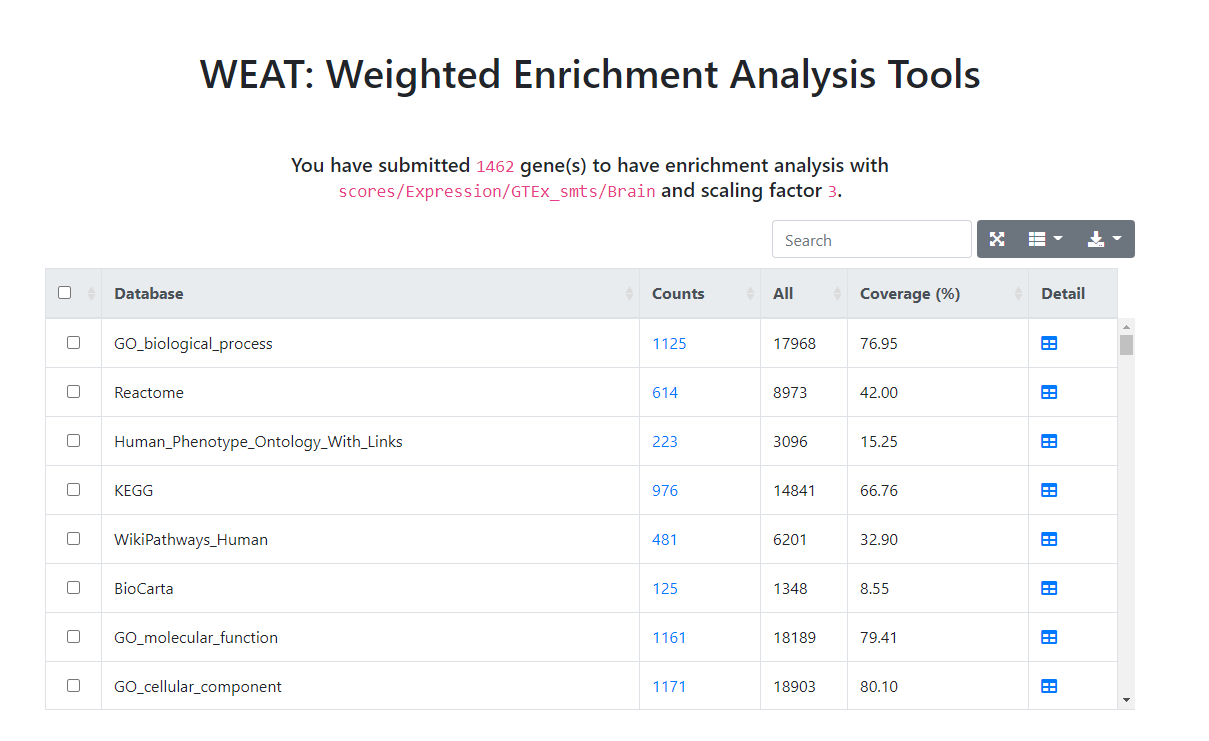
Figure 2. Brief result page.
The
Countcolumn shows the number of genes which is overlapped with the dataset.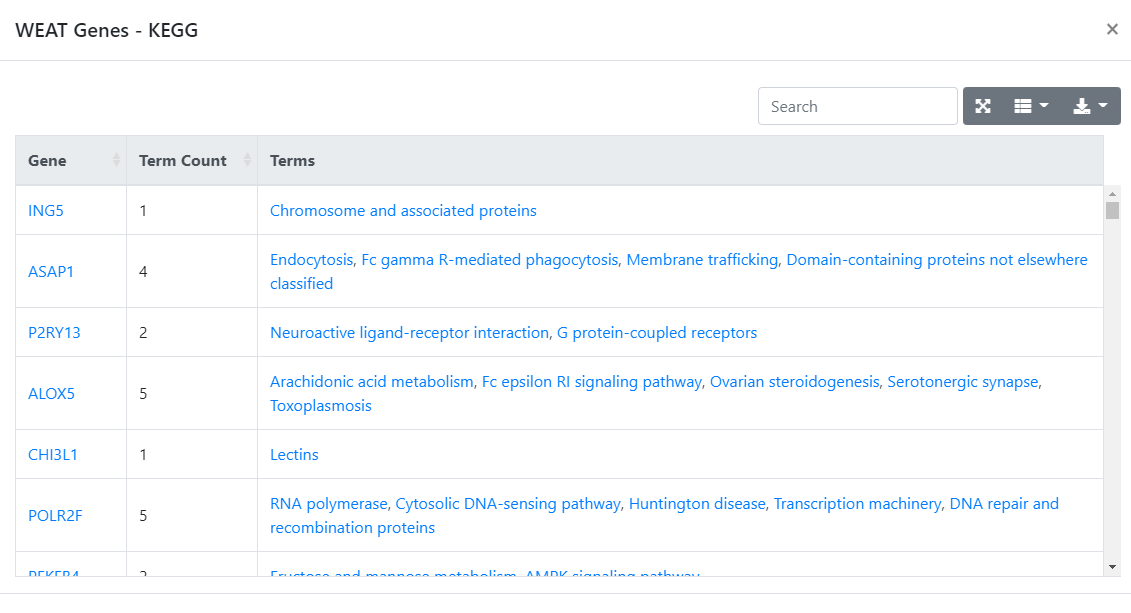
Figure 3. Gene and counts page.
The
Detailcolumn will lead you to the result of the enrichment analysis result. ThePlusbutton located on each terms' left can be clicked for detailed information including unweighted enrichment method p-value and hit or missed genes.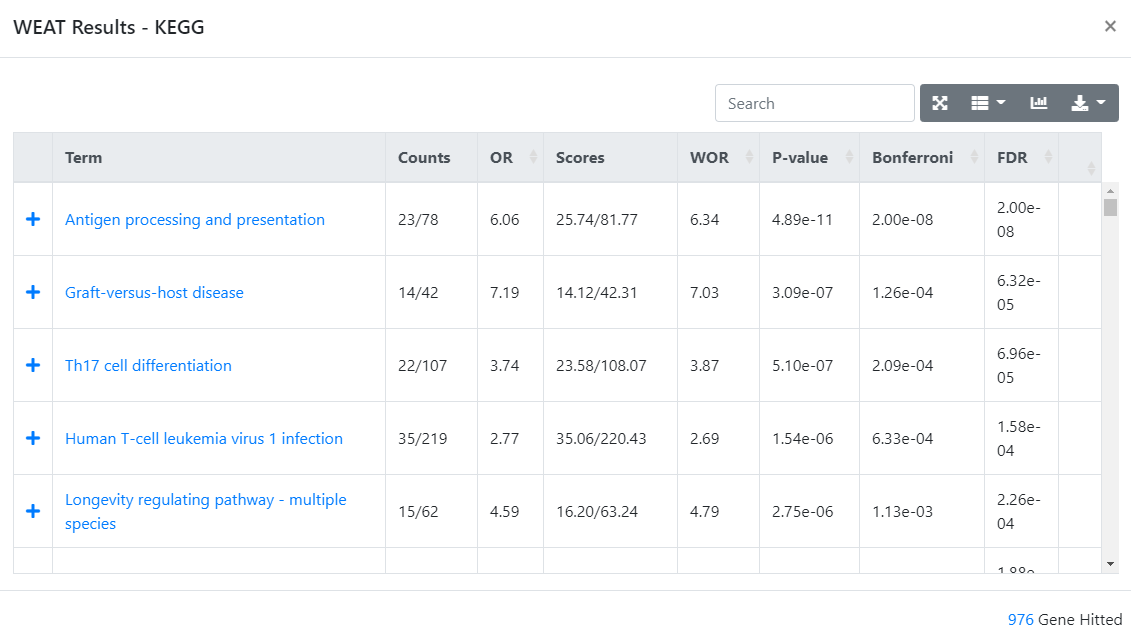
Figure 4. Detail page.
All the text with blue color can be clicked for an external link.
-
For each table, you can
searchfor specific keywords, select hiddencolumns,exportthe table, or show the table forfull screenon the top right of each table. -
For the
WEAT Resulttable, you can alsovisualizethe result by clicking the button on the top right of the table. After selecting the plot options, clickPlotto see the result and you can also download the vector figure inSVGformat by clicking thephotobutton on the top right of the figure.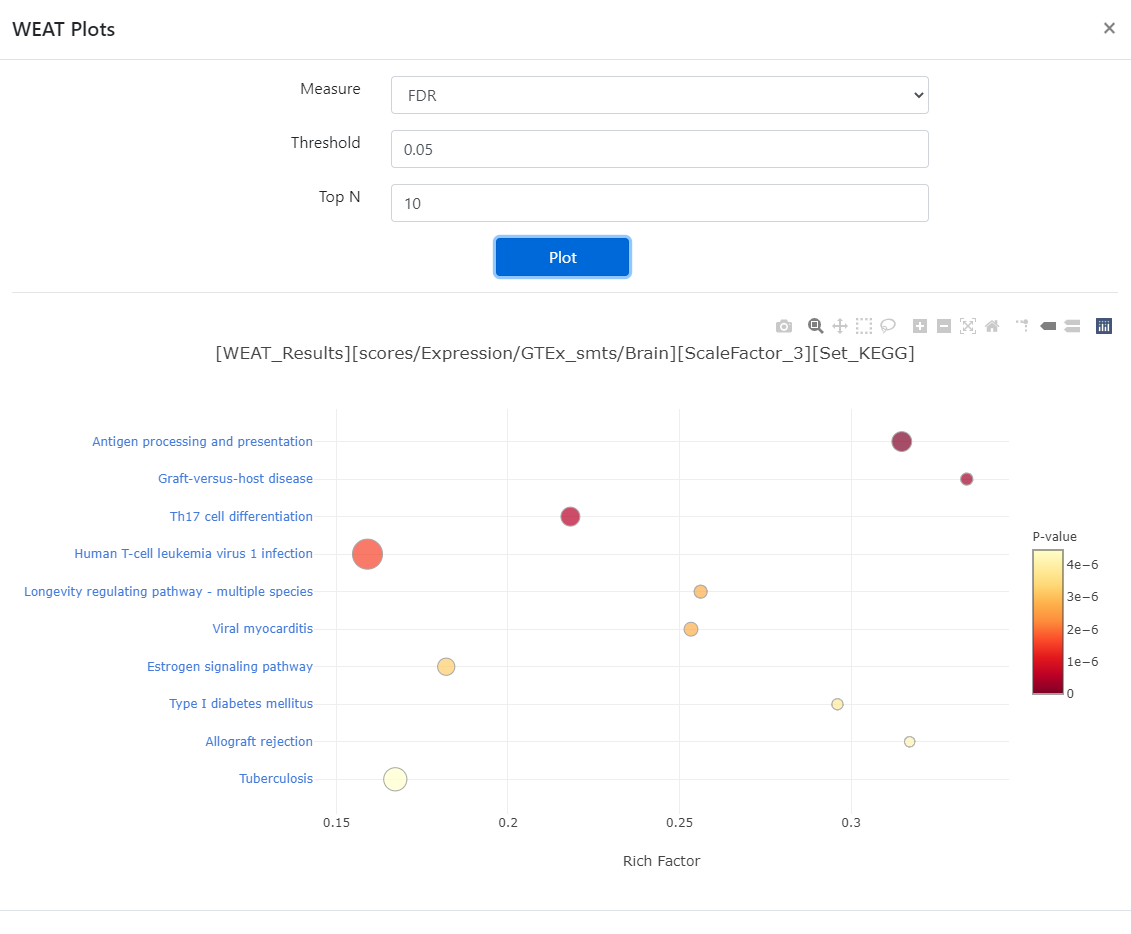
Figure 5. Visualize page.
Source of scores
Table 1.
| Class | Name | Preprocess | Source | Explanation |
|---|---|---|---|---|
| Conservation | phastCons | Average | UCSC | |
| phyloP | Average | UCSC | ||
| Gene Importance | GIC | None | GIC | Zeng et al. |
| DepMap_lineage | Average | DepMap | ||
| DepMap_disease | Average | DepMap | ||
| IDF | [Sets] | Inverse Document Frequency (IDF) | ||
| Protein-Protein Interaction (PPI) | PPI_Degree | Count | STRING | |
| PPI_Score | Sum | STRING | ||
| Expression | GTEx_smts | None | GTEx | GTEx V8; Tissue Type, area from which the tissue sample was taken. |
| GTEx_smtsd | None | GTEx | GTEx V8; Tissue Type, more specific detail of tissue type | |
| PRJEB2445 | None | BioProject | ||
| PRJEB4337 | None | BioProject | ||
| PRJNA270632 | None | BioProject | ||
| PRJNA280600 | None | BioProject | ||
| [project]_log | Log proportion |
FAQs
-
Q: How to select scores?
A: In general, different essential scores are selected based on the point you are interested in. For example, if you just want investigate the biological process happened in specific tissue, we are suggesting the expression profile scores (like GTEx expression profile score) in specific tissue. Similarly, conservation scores can be used to investigate the evolutionarily conserved terms; Gene importance scores can be selected to have research on essential terms; PPI can be used to investigate hub-gene related sets; And IDF is just a correction of specific category. If you don’t have any purpose and preference of interest, we suggest you to have several tries using different essentiality scores to find out some interesting results and what is the relationship among selected scores, pathways and submitted gene list. In addition, we are now providing a function of selecting multiple scores, that is, merging all selected scores to one, which may get rid of the dilemma of choosing scores.
-
Q: What is the format of downloaded figure? What is
svgfile? How to modify it for publication?A: All the figure generated from this website can be download in
svgformat, which is an Extensible Markup Language (XML)-based vector image format. And all major modern web browsers—including Mozilla Firefox, Internet Explorer, Google Chrome, Opera, Safari, and Microsoft Edge—have SVG rendering support.Autogenerated figures are not always looking well and hence we need to modify it before publication. For some simple cases like text replacement, you can just open the
svgfile in any text editor and the find-replace function will help you. For other harder cases, it is ok to modified it text editor. However, we are suggesting you to use any vector graph editor like Adobe Illustrator. It can also convert thesvgformat to any common format you like.