In the era of micriobiome and post-microbiome, tools are emergently needed to mine patterns and explore knowledge from micriobiome data. MicroPattern is a tool used to mine regular rules and patterns behind a list of microbes. As the rapid development of microbiome and metagenome, a number of studies have identified a lot of microbes associated with a variety of disease, phenotypes or traits. Therefore, it becomes very important and emergent for scientists to find informative patterns and knowledge behind the interested microbes identified in a study. MicroPattern is such a tool to mine regular rules and patterns and knowledge from a list of microbes.
The users can find usage details in the "Help" menu.
Step 1: enter your microbe list through left panel.
An example:
Step 2: enter your background microbe list (format same as step 1).
Note: It is not a necessary choice. By default, MicroPattern uses all microbes included in microbe categories as the background
Step 3: Size of microbe category.
Step 4: submit the request.
Disease similarity based on the association between diseases and microbes can be calculated here. We have integrated 483 microbe-disease associations between 39 human disease and 292 microbes from published paper. Users can paste data in the textarea or upload file, which will be integrated with our data and used for calculating disease similarity. The data format is described as following:
1. No header;
2. The first column is diseases and the second column is microbes and the third column is evidence;
3. Different column should be separated by tab;
4. In the evidence column, 1 means the microbe increase while -1 means the microbe decrease. Here are example:
disease microbe 1
disease microbe -1
Enter your data or load your file
Recently, increasing studies of microbiome have identified a number of microbes associated with a variety of human disease and traits. For such a study, a number of analysis methods have been developed, including microbe abundance analysis, diversity analysis, and clustering analysis to analyze the microbiome data. These methods have a big contribution to microbiome research. However, in an era of post-microbiome, novel methods are emergently needed to mine patterns and explore knowledge based on data from microbiome.
For the above purpose, here we developed MicroPattern, a web server to mine regular patterns for a list of microbes, for example the microbes associated with a human trait from one microbiome study. MicroPattern first integrated and curated microbes into various meaningful categories according to their associated human disease and traits. Then, for an input list of microbes, MicroPattern will perform enrichment analysis for the inputted microbes in the integrated microbe categories by hypergeometric test. Finally, MicroPattern will predict the possible patterns associated with the input microbes.
The detailed usage of the MicroPattern is as followings:
[1] Visiting MicroPattern: Log on MicroPattern at http://www.cuilab.cn/micropattern, as shown in Figure 1.
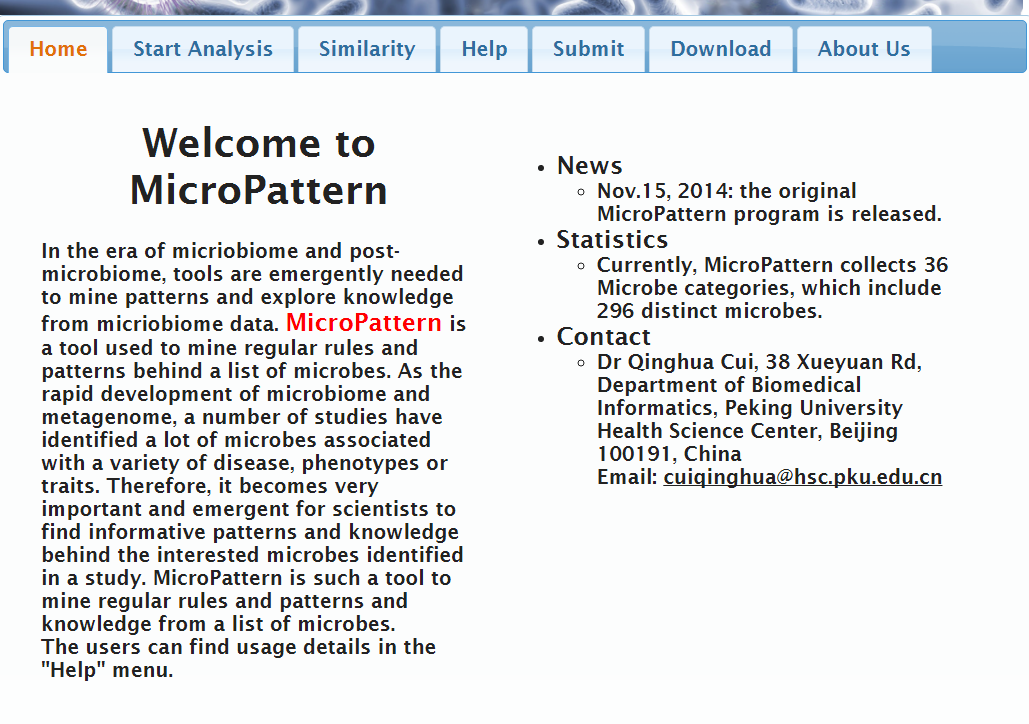
Figure 1.The homepage of MicroPattern
[2] Analysis of a microbe list. The analysis procedure is as follows:
(1) Click the menu "Start Analysis" (red "1" in Figure 2).
(2) Enter a microbe list (red "2" in Figure 2). The following example shows a list of microbes associated with animal-diet from the study by Lawrence A. David et al. (Nature 2014: doi:10.1038/nature12820).
Eubacteriumbiforme
MLG480
Actinobacillus porcinus
Akkermansia
Alistipes finegoldii
Alistipes putredinis
Alistipes
Bacteroides coprocola
Bacteroides fragilis
Bacteroides
Bacteroides salyersiae
Bifidobacterium adolescentis
Bifidobacterium gallicum
Bifidobacterium longum
Bifidobacterium
Bilophila wadsworthia
Blautia producta
Blautia
Catenibacterium
Clostridium bolteae
Clostridium orbiscindens
Clostridium
Collinsella aerofaciens
Coprococcus
Dialister invisus
Dialister
Escherichia
Eubacterium
Faecalibacterium prausnitzii
Faecalibacterium
Lachnobacterium
Lachnospira
Megasphaera elsdenii
Mitsuokella multacida
Odoribacter
Oscillospira
Parabacteroides johnsonii
Parabacteroides
Phascolarctobacterium
Prevotella copri
Prevotella
Raoultella
Roseburia Eubacteriumrectale
Roseburia faecis
Roseburia
Ruminococcus bromii
Ruminococcus callidus
Ruminococcus flavefaciens
Ruminococcus gnavus
Ruminococcus
Sutterella
(3) Enter the background microbe list (red "3" in Figure 2). It is not a necessary choice. By default, MicroPattern uses all microbes included in MicroPattern as the background.
(4) Enter the size range of your interested microbe categories (red "4" in Figure 2). It is also not a necessary choice. By default, MicroPattern uses all the microbe categories bigger than 2.
(5) Click button "Run" to submit request to MicroPattern (red "5" in Figure 2). The result will be shown in a new page (Figure 3).
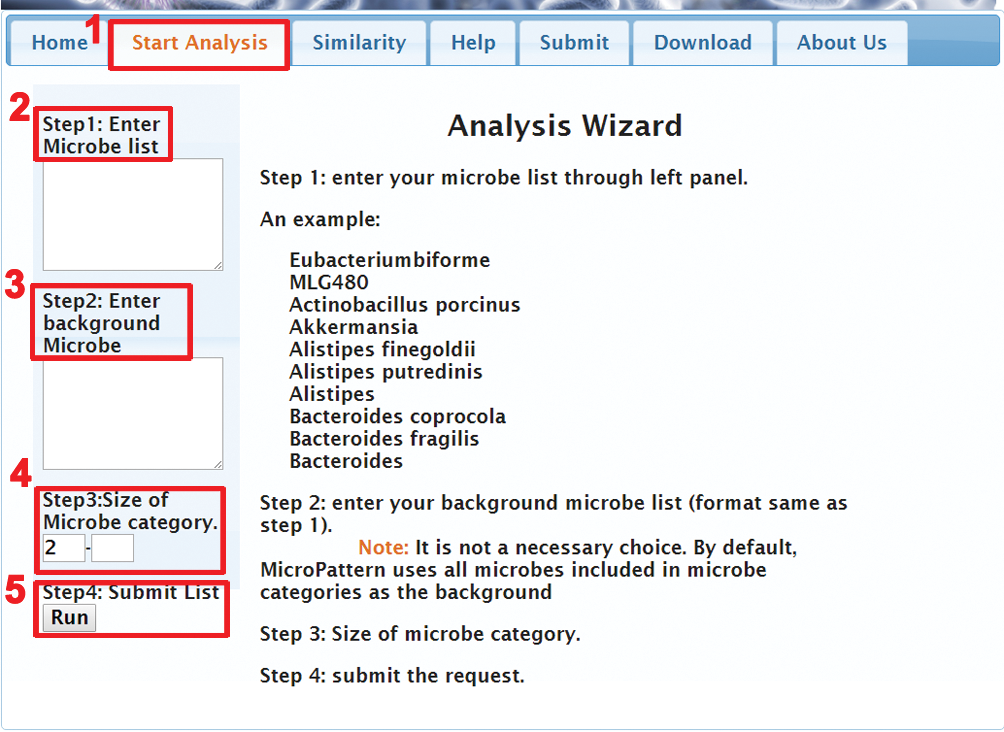
Figure 2. Analysis procedure of MicroPattern
[3] Interpretation of the analysis result for MicroPattern.
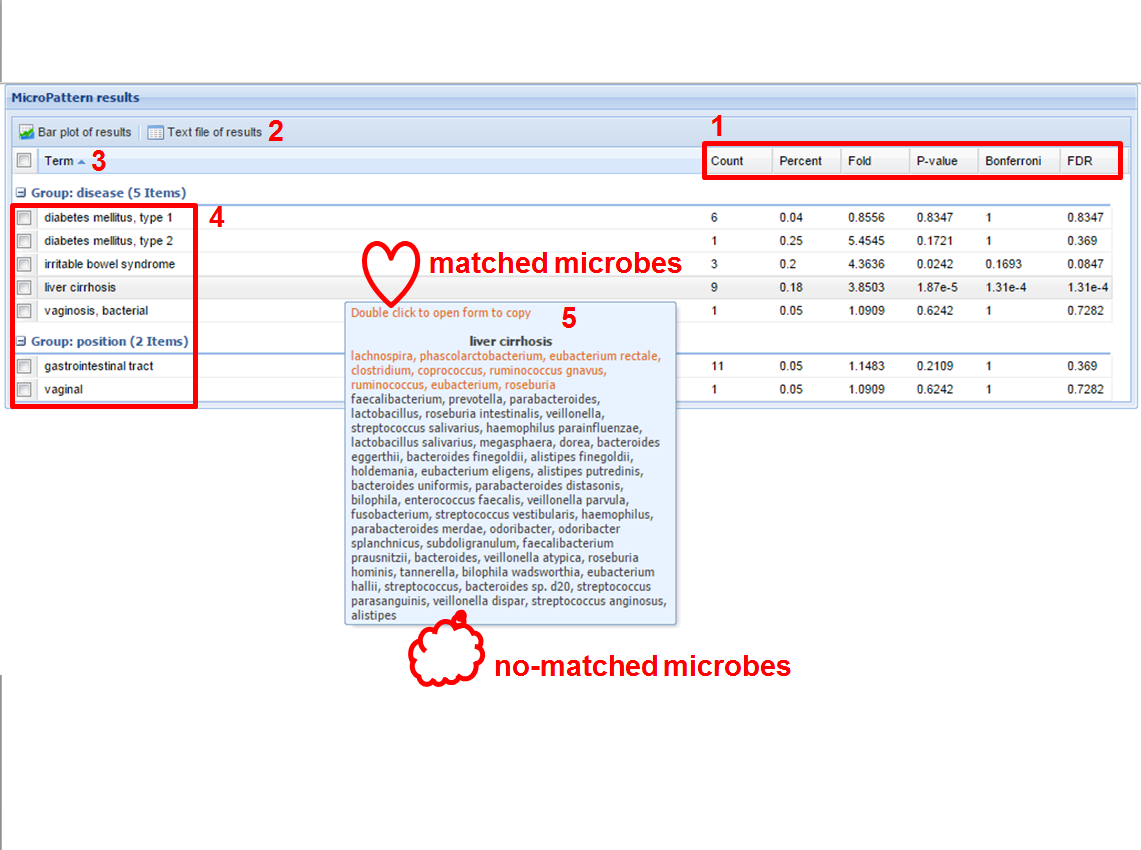
Figure 3. The result of MicroPattern analysis
The mined patterns by MicroPattern are shown in Figure 3. In this page, the users can further perform the following analysis.
(1) Ranking the mined patterns according their significance (Fold, p-value, Bonferroni, or FDR) by clicking corresponding menus (red “1” in Figure 3);
(2) Saving the whole analysis result into a TEXT file by clicking the button of “Text file of results” (red “2” in Figure 3);
(3) Drawing a barplot for interested microbe patterns (red “3” in Figure 3); For doing this, the users need to select the interested patterns (red “4” in Figure 3) and then click “Barplot of results” (red “3” in Figure 3).
(4) Showing the details of a matched pattern. By double-clicking a specific microbe categories (red “5” in Figure 3), one can see the details of one matched microbe pattern. The matched microbes in the corresponding category will be highlighted in red color.
(5) What do the results mean? If the input list of microbes is significantly enriched in one microbe pattern, it will mean that the input microbes associated trait is significantly correlated with the mined pattern. For the presented example, the result means that the animal-based diet associated microbes are significantly correlated with the liver cirrhosis associated ones. This pattern further suggests that there could be a connection between animal-based diet and liver cirrhosis. Increasing studies indeed support this microbe-based prediction made by MicroPattern (Hepatol Res. 2014 May 14. doi: 10.1111/hepr.12358).
In out previous work(PMID:26883326), we proposed a method to calculate similarity between diseases based on microbe-disease association. Here, we provide users of function of calculating similarity between diseases. The detailed usage is as followings: [1] Click the menu "Similarity" (red "1" in Figure 4).
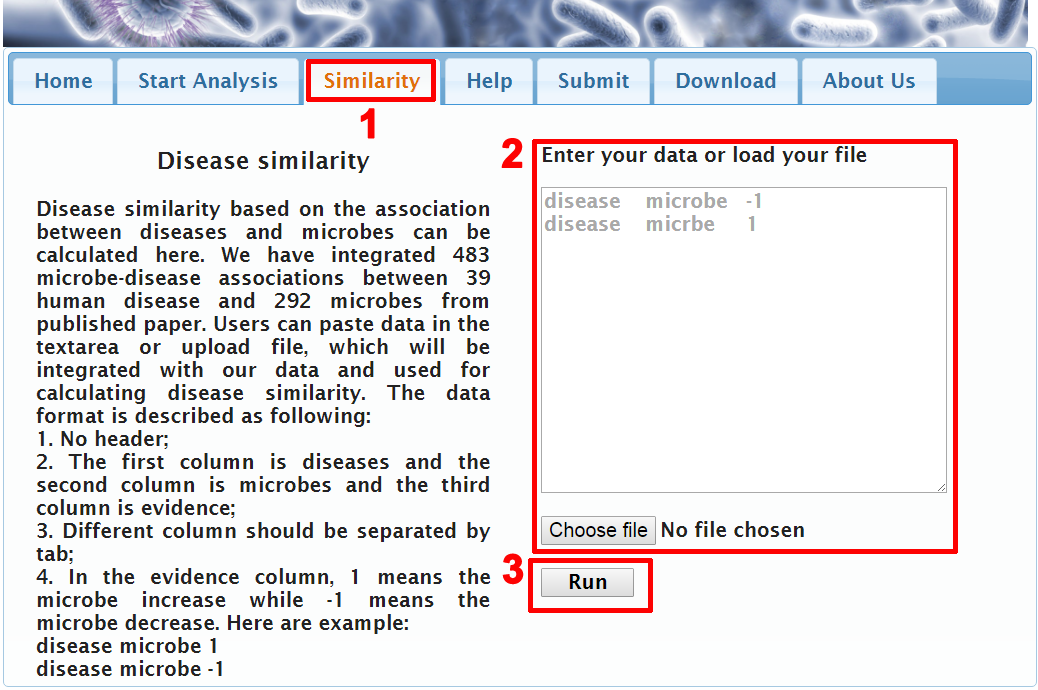
Figure 4. Calculating similarity between disease
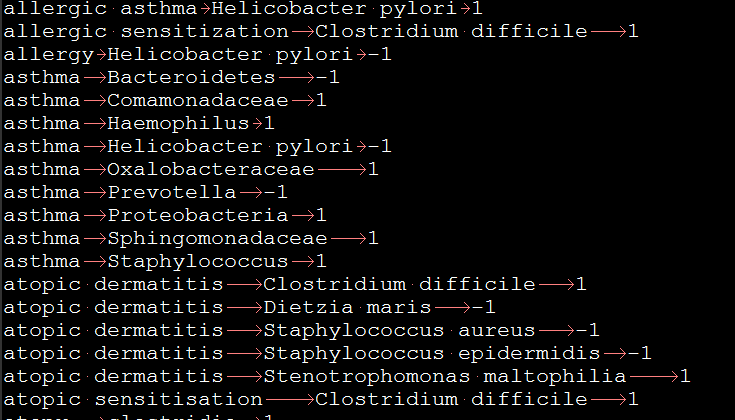
Figure 5. Input data format
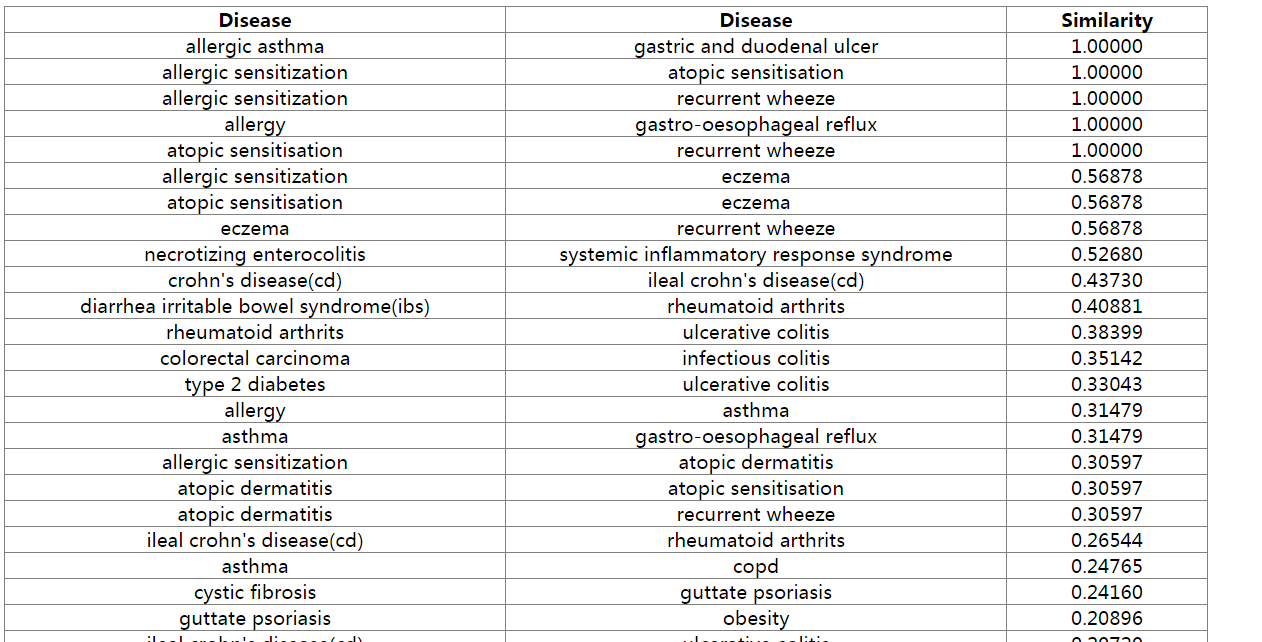
Figure 6. Result
The whole dataset can be downloaded here (Click to download).
We try to understand life using computing.
Dr. Qinghua Cui
Department of Biomedical Informatics
Peking University Health Science Center
38 Xueyuan Rd
Beijing, China 100191
Email: cuiqinghua@hsc.pku.edu.cn
Citation: Ma W, Huang C, Zhou Y, Li J and Cui Q. MicroPattern: a web-based tool for microbe set enrichment analysis and disease similarity calculation based on a list of microbes. Scientific Reports, 2017 Jan 10;7:40200. doi: 10.1038/srep40200.
Ma W, Zhang L, Zeng P, Huang C, Li J, Geng B, Yang J, Kong W, Zhou X, and Cui Q. An analysis of human microbe-disease associations. Briefings in Bioinformatics 2016 Feb 15. pii: bbw005. [Epub ahead of print]